Miki & Varenne
Nuovo Utente
- Registrato
- 18/6/09
- Messaggi
- 48.694
- Punti reazioni
- 332
Ddntro a 4 82
Follow along with the video below to see how to install our site as a web app on your home screen.
Nota: This feature may not be available in some browsers.
Ddntro a 4 82
 chiuse le altre
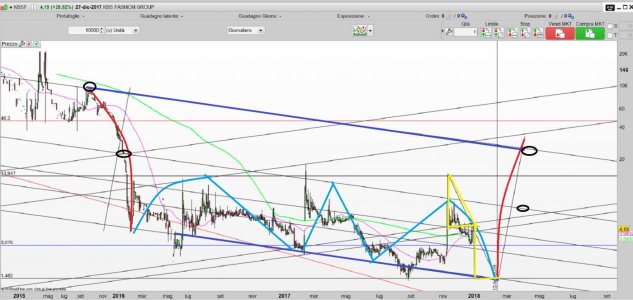
ElEMENTARE PULL BACK SULLA BASE DEL TRIANGOLO ROTTO AL RIBASSO ED AVENTE TARGET 1,50-1,40 CIRCA ENTRO META' FEBBRAIO 2018(DOVE ENTRERO' IN ACQUISTO).
OGGI ANDRO' AL RIBASSO SUL TITOLO CHE E' QUINDI UNO STRONG SELL DA MANUALE FALCHIANO CON SIMMETRIA ARMONICA PRATICAMENTE PERFETTA.
MEDITATE GENTE, MEDITATE!!!!!!!!!!!!!!!!!!!!!!
 signor volatile mi dice come fa a shortare uno stock , che non é , ne shortabile ne opzionabile....e non essendoci istituzionali e insider nel capitale ..il flottante di 1.700k di azioni é solo in mano dei dirigenti....vabene che tu sei una leggenda...( ...de ché?) ...ma prima di scrivere l'ennesima caxxata....informati prima sull'azienda