Installa l'app
How to install the app on iOS
Follow along with the video below to see how to install our site as a web app on your home screen.
Nota: This feature may not be available in some browsers.
Stai usando un browser molto obsoleto. Puoi incorrere in problemi di visualizzazione di questo e altri siti oltre che in problemi di sicurezza. .
Dovresti aggiornarlo oppure usare usarne uno alternativo, moderno e sicuro.
Dovresti aggiornarlo oppure usare usarne uno alternativo, moderno e sicuro.
Digital Angel (DIGA, Nasdaq Glob.Sel.M.; ex-Adsx)
- Creatore Discussione otero
- Data di inizio
Più opzioni
Chi ha risposto?")
Veniamo da quì:
http://www.finanzaonline.com/forum/showthread.php?t=1171025
http://www.finanzaonline.com/forum/showthread.php?t=1171025
Sal.Vi
❖ Sa!Vi World Wide ❖
- Registrato
- 21/9/08
- Messaggi
- 8.422
- Punti reazioni
- 528
DIGA [ex-ADSX]
$@!V€ A TUTTI. Uno dei migliori traders del FoL mi ha chiesto (onorandomi di ciò) una mia view su DIGA. Trattasi comunque di un nuovo modo di redarre post totalmente operativi su una company e utilizzabili da un qualsiasi utente per una analisi grafica e/o di bilancio istantanea. La piattaforma, come è ovvio, è decisamente migliorabile.
DIGA data.
Site
Digital Angel Corporation (Digital Angel, formerly Applied Digital Solutions, ADSX: 490 Villaume Avenue, South St. Paul MN 55075), incorporated on May 11, 1993, is engaged in the operations of its wholly owned subsidiary, Destron Fearing Corporation, and its 98.5% owned subsidiary, Signature Industries Limited (Signature). As of December 31, 2009, the operated in two business segments: Animal Identification, which comprises the operations of Destron Fearing; and Emergency Identification, which comprises the operations of Signature. The Company encompass the development and marketing of radio frequency identification (RFID) and global position systems (GPS) -enabled identification and location products. In November 2009, the Company completed the sale of McMurdo unit.
The Company’s Animal Identification segment (http://www.destronfearing.com/) develops, manufactures and markets visual and electronic identification tags and implantable RFID microchips, primarily for identification, tracking and location of companion pets, livestock, horses, fish and wildlife worldwide, for animal bio-sensing applications, such as temperature reading for companion pet and livestock applications. Its Animal Identification segment’s products focus on pet identification and safeguarding, as well as the positive identification and tracking of livestock and fish, which is crucial for asset management and for disease control and food safety. This segment’s principal products include visual and electronic ear tags for livestock, implantable microchips and RFID scanners for the companion pet, livestock, horses, fish and wildlife industries.
The Company’s pet identification and location system involves the insertion of a microchip, with identifying information, in the animal. Scanners located at animal shelters, veterinary clinics and other locations can determine the animal’s owner and other information. Its RFID microchips are also used for the tagging of fish, especially salmon, for identification by biologists and governments in environmental programs and studies, migratory studies and other purposes.
The Company competes with http://www.allflexusa.com/, Inc., http://www.ytex.com/, http://www.datamars.com/ and http://www.avidid.com/.
Emergency Identification Segment
The Company’s Emergency Identification segment’s (http://www.signatureindustries.com/) products provide emergency location and tracking of pilots, aircraft and maritime vehicles in remote locations as well as sound horn alarms.
This segment’s principal products include GPS enabled search and rescue equipment and intelligent communications products and services for mobile data and radio communications applications, including our SARBE brand, which serves commercial and military markets; and
alarm sounders for industrial use and other electronic components. Its personal locator beacons (PLBs) are sold under the http://www.sarbe.com/ brand name. SARBE products are primarily used by military air crew in the event of an ejection or other event requiring emergency evacuation of an aircraft in a remote, possibly hostile location. SARBE equipment is also used by land and naval forces. The Company manufactures electronic alarm sounders under the Clifford & Snell name. These products are used to provide audible and or visual signals, which alert personnel in hazardous areas, including the oil and petrochemical industry, and in the fire and security market.
The Company competes with Boeing North American Inc., General Dynamics Decision Systems, http://www.tadspec.com/home.php, http://www.becker-avionics.com/, and http://www.acrelectronics.com/
Board
Fin.Data
Fin.Data
SEC
Owners
Short-data
Short-data
Options
News by company
News by GOG
Products
I.R.
Competitors
http://www.reuters.com/finance/stocks/overview?symbol=AVID.OQ
http://www.reuters.com/finance/stocks/overview?symbol=BA.N
http://www.reuters.com/finance/stocks/overview?symbol=GD.N
http://www.reuters.com/finance/stocks/overview?symbol=ESLT.TA
http://www.google.com/finance?q=NASDAQ:AMAC
F.o.L. as DIGA
http://www.finanzaonline.com/forum/showthread.php?t=1171025
http://www.finanzaonline.com/forum/showthread.php?t=990810
http://www.finanzaonline.com/forum/showthread.php?t=1100390
F.o.L. as ADSX
http://www.finanzaonline.com/forum/showthread.php?t=773726
http://www.finanzaonline.com/forum/showthread.php?t=501182
http://www.finanzaonline.com/forum/showthread.php?t=818780
http://www.finanzaonline.com/forum/showthread.php?t=801371
http://www.finanzaonline.com/forum/showthread.php?t=715457
DIGA charts [ Linear Chart -- Semilog Chart ]
Chart ema-format: price replaced by dots (daily close), with short term exp.mov.aver. 5/10/20, and some medium-long term exp.mov.aver.
Attached chart in monthly-candles-format: price as candles in monthly frame.
Attached chart in weekly-barrs-format: price as barrs in weekly frame with main simple moving averages.
Attached chart in average-indicators-format: two-envelopes method (short-term envelopes in blu vs. long-term envelopes in red) and MACD, PPO, TRIX in medium-term frame; price in daily-ema/5.
Pink-fuxia level as book-value line.
Come anticipato dalla precedente analisi, sui chart in intraday si osserva una corrente volumetrica d'accompagnamento al bull-cross della 0.6-line, corrispondente al gap-close.
Ciò era prevedibile (ma non certo, ovviamente) sulla base dalla peculiare configurazione di inside daily del 31/03/2010, con top esatto sulla gap-area: le close giornaliere post 31/03, si son mantenute mediamente sul 50% della 31/03 stessa !
Instant-target/I, post-inside pertanto 0.74 $, con interessamento (su raggiungimento) dei tops-2010 !
Segnale negativo per i longs di breve, sotto 0.58 $. Key level low-apr.2010.
Dal chart automatico daily Finviz si vede la rottura del canale discendente con proiezione l'area della sma/200 ma anche i corsi ben sopra la sma/20 e la sma/50, con sma/20 > sma/50.
Pertanto la company viaggia nella regione superiore delle Boll.B. ed ha maturato un silver-cross tra le medie semplici, che ne rafforza la struttura bullish di breve-medio, proiettando la company verso sma/200.
Detto rafforzamento lo si evince dal chart in average-indicators-format, con tre distinti buy-signs (aree marcate in arancio).
Sul weekly automatico si vede un buy-sign sul primo oscillatore, un imminente buy-sign sul secondo, ed un imminente close della forbice, in bullish-status, su DM+/DM-; se in settimana prossima si dovessero confermare i tre segni allora il rialzo potrebbe divenire strutturale sul medio termine.
Sul mensile automatico, gli oscillatori scelti segnalano tentativo di reverse, dal bear di lungo termine, in atto; pertanto la fase è decisamente interessante dal punto di vista rischio/ritorno
Sul chart automatico in ema-format si vede come le tre ema veloci sono in assetto bullish, secanti la ema/50 e proiettate verso ema/200 almeno.
Controllando le proiezioni automatiche fornite dai P&F di StockChart si rilevano i seguenti target:
1% price-boxe: target 1.0 $
2% price-boxe: target 1.0 $
3% price-boxe: target 0.64 $ (meet).
Sulla base di quanto finora segnalato, si individua un target di breve a 0.74 $ attivatosi alla rottura di top 31/03 a quota 0.60 $; un secondo target, individuabile come area, e centrata tra la ema/200, sma/200, i target P&F ed i lows autunno-2009 [*].
Plottando la book-value line sui chart attached si vede come l'attuale reazione della company è stata proprio contenuta in close weekly dal raggiungimento quasi perfetto della stessa book-value.
A questo punto sui mensili e settimanali allegati appaiono evidenti i livelli di plausibili target di breve-medio, una volta consolidata la book-line:
a) la blu di feb.2010 è contenitiva di mar.2010 e attualmente superata al rialzo in modo frazionale, con target preliminare su tenuta della book-line = 0.94 $ [*]
b) top della cupola di triplo lows 0.39/0.40 2008/2009/2010, con target = 1.89 $
c) lows-dic.2007 = 3.28 $ [***]
d) la convalida del triplo lows su rottura di 1.89 avrebbe una proiezione di 1.49 $ sul top di 1.89 e target = 3.38 $ [***]
Con un'area marcata in verde si indica una interessante zona di confluenza tra i lows 2001/2003 ed ema 200/weekly; tale area [9/13 $ about] potrebbe fungere da forte attrattore in caso di superamento dei precedenti target di breve-medio e svolta positiva della company sul fronte bilancio.
I vari step indicati vanno seguiti con take-profit e/o con innalzamento degli stops.
Livelli chiave al ribasso:
book-value line
0.58 $
low-apr.2010, sotto il cui livello si ri-esacerberebbe il bear strutturale con plausibile re-interessamento del triplo lows.
Il quadro viene completato con alcuni dati di bilancio in chiave comparativa con le company competitors quotate:
DIGA
P/S: 0.28; P/B: 0.80; P/E: -; P/Fr.Ca.Fl.: -; RoA: -27.7; RoE: -7.9; RoI: -60; Ass.Turn.: 0.89
AVID
P/S: 0.94; P/B: 1.32; P/E: -; P/Fr.Ca.Fl.: -; RoA: -10.4; RoE: -14.6; RoI: -14.2; Ass.Turn.: 0.96
BA
P/S: 0.85; P/B: 19.37; P/E: 45.3; P/Fr.Ca.Fl.: 19.25; RoA: +2.1; RoE: +108.7; RoI: +4.5; Ass.Turn.: 1.13
GD
P/S: 0.94; P/B: 2.44; P/E: 12.7; P/Fr.Ca.Fl.: 16.09; RoA: +8.1; RoE: +21.4; RoI: +12.4; Ass.Turn.: 1.08
ESLT.ta
P/S: 0.96; P/B: 3.27; P/E: 12.8; P/Fr.Ca.Fl.: 23; RoA: +7; RoE: +27.6; RoI: +12.5; Ass.Turn.: 0.95
AMAC
P/S:1.57; P/B: 2.21; P/E: 21.8; P/Fr.Ca.Fl.: 11.24; RoA: +8.23; RoE: +10.8; RoI: +9.44; Ass.Turn.: 1.12
Automatic Intraday Charts


Automatic Charts in superior frames


Automatic chart in ema-format

I M O
N.B.: per trasparenza si comunica che lo scrivente potrebbe possedere, direttamente e/o indirettamente, quote degli strumenti finanziari in oggetto o ad essi correlati. Non si forniscono pertanto in alcun modo, raccomandazioni e/o segnali di vendita-acquisto sugli strumenti finanziari in oggetto o ad essi correlati.
Disclaimer manthra - New F.o.L. Order
$@!V€ A TUTTI. Uno dei migliori traders del FoL mi ha chiesto (onorandomi di ciò) una mia view su DIGA. Trattasi comunque di un nuovo modo di redarre post totalmente operativi su una company e utilizzabili da un qualsiasi utente per una analisi grafica e/o di bilancio istantanea. La piattaforma, come è ovvio, è decisamente migliorabile.
DIGA data.
Site
Digital Angel Corporation (Digital Angel, formerly Applied Digital Solutions, ADSX: 490 Villaume Avenue, South St. Paul MN 55075), incorporated on May 11, 1993, is engaged in the operations of its wholly owned subsidiary, Destron Fearing Corporation, and its 98.5% owned subsidiary, Signature Industries Limited (Signature). As of December 31, 2009, the operated in two business segments: Animal Identification, which comprises the operations of Destron Fearing; and Emergency Identification, which comprises the operations of Signature. The Company encompass the development and marketing of radio frequency identification (RFID) and global position systems (GPS) -enabled identification and location products. In November 2009, the Company completed the sale of McMurdo unit.
The Company’s Animal Identification segment (http://www.destronfearing.com/) develops, manufactures and markets visual and electronic identification tags and implantable RFID microchips, primarily for identification, tracking and location of companion pets, livestock, horses, fish and wildlife worldwide, for animal bio-sensing applications, such as temperature reading for companion pet and livestock applications. Its Animal Identification segment’s products focus on pet identification and safeguarding, as well as the positive identification and tracking of livestock and fish, which is crucial for asset management and for disease control and food safety. This segment’s principal products include visual and electronic ear tags for livestock, implantable microchips and RFID scanners for the companion pet, livestock, horses, fish and wildlife industries.
The Company’s pet identification and location system involves the insertion of a microchip, with identifying information, in the animal. Scanners located at animal shelters, veterinary clinics and other locations can determine the animal’s owner and other information. Its RFID microchips are also used for the tagging of fish, especially salmon, for identification by biologists and governments in environmental programs and studies, migratory studies and other purposes.
The Company competes with http://www.allflexusa.com/, Inc., http://www.ytex.com/, http://www.datamars.com/ and http://www.avidid.com/.
Emergency Identification Segment
The Company’s Emergency Identification segment’s (http://www.signatureindustries.com/) products provide emergency location and tracking of pilots, aircraft and maritime vehicles in remote locations as well as sound horn alarms.
This segment’s principal products include GPS enabled search and rescue equipment and intelligent communications products and services for mobile data and radio communications applications, including our SARBE brand, which serves commercial and military markets; and
alarm sounders for industrial use and other electronic components. Its personal locator beacons (PLBs) are sold under the http://www.sarbe.com/ brand name. SARBE products are primarily used by military air crew in the event of an ejection or other event requiring emergency evacuation of an aircraft in a remote, possibly hostile location. SARBE equipment is also used by land and naval forces. The Company manufactures electronic alarm sounders under the Clifford & Snell name. These products are used to provide audible and or visual signals, which alert personnel in hazardous areas, including the oil and petrochemical industry, and in the fire and security market.
The Company competes with Boeing North American Inc., General Dynamics Decision Systems, http://www.tadspec.com/home.php, http://www.becker-avionics.com/, and http://www.acrelectronics.com/
Board
Fin.Data
Fin.Data
SEC
Owners
Short-data
Short-data
Options
News by company
News by GOG
Products
I.R.
Competitors
http://www.reuters.com/finance/stocks/overview?symbol=AVID.OQ
http://www.reuters.com/finance/stocks/overview?symbol=BA.N
http://www.reuters.com/finance/stocks/overview?symbol=GD.N
http://www.reuters.com/finance/stocks/overview?symbol=ESLT.TA
http://www.google.com/finance?q=NASDAQ:AMAC
F.o.L. as DIGA
http://www.finanzaonline.com/forum/showthread.php?t=1171025
http://www.finanzaonline.com/forum/showthread.php?t=990810
http://www.finanzaonline.com/forum/showthread.php?t=1100390
F.o.L. as ADSX
http://www.finanzaonline.com/forum/showthread.php?t=773726
http://www.finanzaonline.com/forum/showthread.php?t=501182
http://www.finanzaonline.com/forum/showthread.php?t=818780
http://www.finanzaonline.com/forum/showthread.php?t=801371
http://www.finanzaonline.com/forum/showthread.php?t=715457
DIGA charts [ Linear Chart -- Semilog Chart ]
Chart ema-format: price replaced by dots (daily close), with short term exp.mov.aver. 5/10/20, and some medium-long term exp.mov.aver.
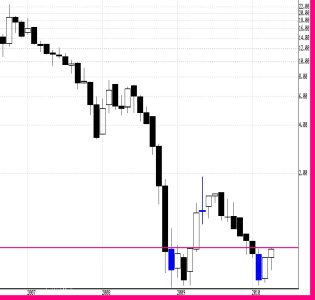
Attached chart in monthly-candles-format: price as candles in monthly frame.
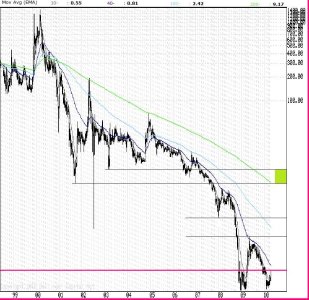
Attached chart in weekly-barrs-format: price as barrs in weekly frame with main simple moving averages.
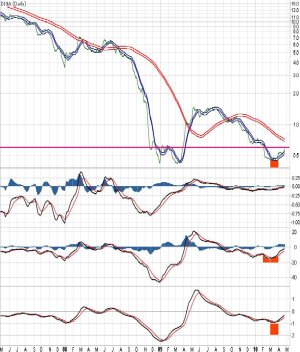
Attached chart in average-indicators-format: two-envelopes method (short-term envelopes in blu vs. long-term envelopes in red) and MACD, PPO, TRIX in medium-term frame; price in daily-ema/5.
Pink-fuxia level as book-value line.
Come anticipato dalla precedente analisi, sui chart in intraday si osserva una corrente volumetrica d'accompagnamento al bull-cross della 0.6-line, corrispondente al gap-close.
Ciò era prevedibile (ma non certo, ovviamente) sulla base dalla peculiare configurazione di inside daily del 31/03/2010, con top esatto sulla gap-area: le close giornaliere post 31/03, si son mantenute mediamente sul 50% della 31/03 stessa !
Instant-target/I, post-inside pertanto 0.74 $, con interessamento (su raggiungimento) dei tops-2010 !
Segnale negativo per i longs di breve, sotto 0.58 $. Key level low-apr.2010.
Dal chart automatico daily Finviz si vede la rottura del canale discendente con proiezione l'area della sma/200 ma anche i corsi ben sopra la sma/20 e la sma/50, con sma/20 > sma/50.
Pertanto la company viaggia nella regione superiore delle Boll.B. ed ha maturato un silver-cross tra le medie semplici, che ne rafforza la struttura bullish di breve-medio, proiettando la company verso sma/200.
Detto rafforzamento lo si evince dal chart in average-indicators-format, con tre distinti buy-signs (aree marcate in arancio).
Sul weekly automatico si vede un buy-sign sul primo oscillatore, un imminente buy-sign sul secondo, ed un imminente close della forbice, in bullish-status, su DM+/DM-; se in settimana prossima si dovessero confermare i tre segni allora il rialzo potrebbe divenire strutturale sul medio termine.
Sul mensile automatico, gli oscillatori scelti segnalano tentativo di reverse, dal bear di lungo termine, in atto; pertanto la fase è decisamente interessante dal punto di vista rischio/ritorno
Sul chart automatico in ema-format si vede come le tre ema veloci sono in assetto bullish, secanti la ema/50 e proiettate verso ema/200 almeno.
Controllando le proiezioni automatiche fornite dai P&F di StockChart si rilevano i seguenti target:
1% price-boxe: target 1.0 $
2% price-boxe: target 1.0 $
3% price-boxe: target 0.64 $ (meet).
Sulla base di quanto finora segnalato, si individua un target di breve a 0.74 $ attivatosi alla rottura di top 31/03 a quota 0.60 $; un secondo target, individuabile come area, e centrata tra la ema/200, sma/200, i target P&F ed i lows autunno-2009 [*].
Plottando la book-value line sui chart attached si vede come l'attuale reazione della company è stata proprio contenuta in close weekly dal raggiungimento quasi perfetto della stessa book-value.
A questo punto sui mensili e settimanali allegati appaiono evidenti i livelli di plausibili target di breve-medio, una volta consolidata la book-line:
a) la blu di feb.2010 è contenitiva di mar.2010 e attualmente superata al rialzo in modo frazionale, con target preliminare su tenuta della book-line = 0.94 $ [*]
b) top della cupola di triplo lows 0.39/0.40 2008/2009/2010, con target = 1.89 $
c) lows-dic.2007 = 3.28 $ [***]
d) la convalida del triplo lows su rottura di 1.89 avrebbe una proiezione di 1.49 $ sul top di 1.89 e target = 3.38 $ [***]
Con un'area marcata in verde si indica una interessante zona di confluenza tra i lows 2001/2003 ed ema 200/weekly; tale area [9/13 $ about] potrebbe fungere da forte attrattore in caso di superamento dei precedenti target di breve-medio e svolta positiva della company sul fronte bilancio.
I vari step indicati vanno seguiti con take-profit e/o con innalzamento degli stops.
Livelli chiave al ribasso:
book-value line
0.58 $
low-apr.2010, sotto il cui livello si ri-esacerberebbe il bear strutturale con plausibile re-interessamento del triplo lows.
Il quadro viene completato con alcuni dati di bilancio in chiave comparativa con le company competitors quotate:
DIGA
P/S: 0.28; P/B: 0.80; P/E: -; P/Fr.Ca.Fl.: -; RoA: -27.7; RoE: -7.9; RoI: -60; Ass.Turn.: 0.89
AVID
P/S: 0.94; P/B: 1.32; P/E: -; P/Fr.Ca.Fl.: -; RoA: -10.4; RoE: -14.6; RoI: -14.2; Ass.Turn.: 0.96
BA
P/S: 0.85; P/B: 19.37; P/E: 45.3; P/Fr.Ca.Fl.: 19.25; RoA: +2.1; RoE: +108.7; RoI: +4.5; Ass.Turn.: 1.13
GD
P/S: 0.94; P/B: 2.44; P/E: 12.7; P/Fr.Ca.Fl.: 16.09; RoA: +8.1; RoE: +21.4; RoI: +12.4; Ass.Turn.: 1.08
ESLT.ta
P/S: 0.96; P/B: 3.27; P/E: 12.8; P/Fr.Ca.Fl.: 23; RoA: +7; RoE: +27.6; RoI: +12.5; Ass.Turn.: 0.95
AMAC
P/S:1.57; P/B: 2.21; P/E: 21.8; P/Fr.Ca.Fl.: 11.24; RoA: +8.23; RoE: +10.8; RoI: +9.44; Ass.Turn.: 1.12
Automatic Intraday Charts
Automatic Charts in superior frames
Automatic chart in ema-format
I M O
N.B.: per trasparenza si comunica che lo scrivente potrebbe possedere, direttamente e/o indirettamente, quote degli strumenti finanziari in oggetto o ad essi correlati. Non si forniscono pertanto in alcun modo, raccomandazioni e/o segnali di vendita-acquisto sugli strumenti finanziari in oggetto o ad essi correlati.
Disclaimer manthra - New F.o.L. Order
Allegati
Jordan1972
Nuovo Utente
- Registrato
- 13/12/04
- Messaggi
- 2.227
- Punti reazioni
- 93
0,85$ ????
ingmarinelli
Nuovo Utente
- Registrato
- 5/10/05
- Messaggi
- 674
- Punti reazioni
- 14
Volumi?
molto elevati rispetto alla media penso non sia finita ....
MadMat
Nuovo Utente
- Registrato
- 28/2/08
- Messaggi
- 4.451
- Punti reazioni
- 133
tp di breve?
0.75 poi 0.8... solo si scoprirà se avrà la forza di arrivare più su. I volumi ci sono, anche ad aprile maggio dell'anno scorso fece un movimento simile e con volumi non eclatanti.
Tirare su gli stop e lasciare correre!
abbiamo 0,75 nel mirino
Arrivati a 0,75
Vediamo come prosegue!