XVOL
Codice:
Var: xvol(0),bn(0),minim(0),massim(0),BALANCE,ZONA1;
Var: max1,min1,medio1;
if isfirstbarday then
xvol=0;bn=0;minim=0;massim=0;endif;
max1=eod.h;
min1=eod.l;
medio1 = (max1+min1)/2;
if xvol < minim then minim = xvol;endif;
if xvol > massim then massim = xvol;endif;
if c > c[1] then xvol=xvol+v;bn=1;endif;
if c < c[1] then xvol=xvol-v;bn=2;endif;
if c = c[1] and bn=1 then xvol=xvol+v;endif;
if c = c[1] and bn=2 then xvol=xvol-v;endif;
balance=(minim+massim)/2;
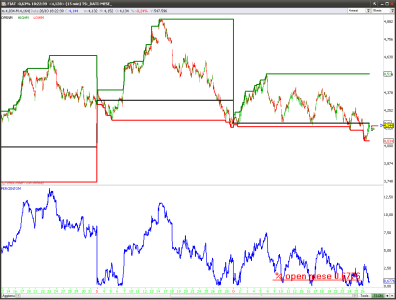
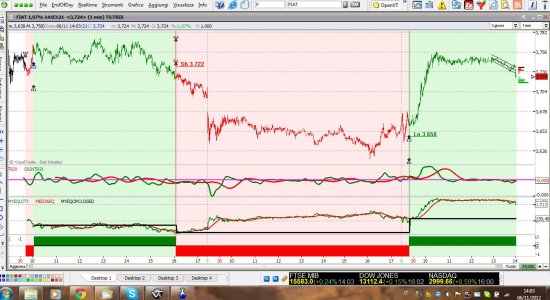
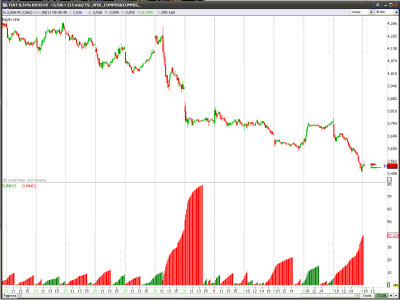
ZONA1=CREATEVIEWPORT (600, TRUE, TRUE);
plotchart(XVOL,ZONA1,COLUPDOWNVAL, solid, 2);
plotchart(MASSIM,ZONA1,BLACK, solid, 2);
plotchart(MINIM,ZONA1,BLACK, solid, 2);
plotchart(BALANCE,ZONA1,BLACK, solid, 2);
plotchart(medio1,0,BLACK, solid, 2);
plotchart(max1,0,BLACK, solid, 2);
plotchart(min1,0,BLACK, solid, 2);
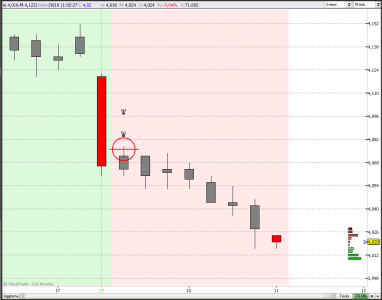
if c>medio1 and xvol<balance then colorbar(gray);endif;
if c<medio1 and xvol>balance then colorbar(gray);endif;
if c<medio1 and xvol<balance then colorbar(red);endif;
if c>medio1 and xvol>balance then colorbar(lime);endif;