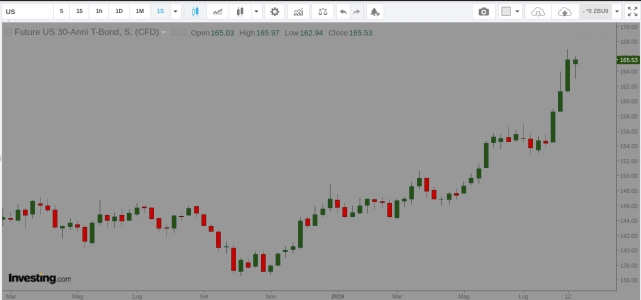
e questa la mia macro-economica sui tassi. sintesi: sono bullish sui tresuries per Q3/Q4.
Tecnicamente sono in overbought massiccio pertanto un pull down a breve termine e ' piu' che possibile.
Outlook Q3 2019
The risk of the US economy entering the vulnerable economic window has increased significantly. The expected revisions to the nonfarm payrolls numbers, which will not be publicized until February 2020,
are likely to shift the growth rate closer to 1.3% from 1.5%.
Given that employment is one main factor to the coincident index, the economy, from the employment sector, is weaker than the data previously estimated.
If we look at the coincident measure of employment, which is not adjusted for the new revisions, we can see employment growth at one of the lowest levels of this economic cycle.
This index contains nonfarm payrolls growth, the unemployment rate, and measures from the household survey of employment and seeks to track the growth rate of the employment sector on a coincident basis.
As the chart above shows, inflation expectations have declined below the December 2018 level which is telling. Oil prices are quite a bit higher today than the low point in December yet inflation expectations are considerably lower, highlighting how strong the disinflationary impulse in the US economy has become.
A longer-term chart, graphed below, shows that while inflation expectations have declined sharply over the past year, inflation expectations are still higher than 2015-2016.
If we recall from the International Trends section, this is contrary to Europe which is seeing inflation expectations plunge below the 2015-2016 level.
Forward measures of inflation continue to move to the downside, emphasizing the risk that US inflation expectations could move similar to European inflation expectations and a revisit of the 2015-2016 lows is reasonably probable.
All else equal, that decline in inflation expectations, would send the belly of the UST curve down another 35bps, putting the 5-year rate near 1%.
The inflation cycle downturn is real, and a major cause of the decline in US rates. Not a drag from European rates.
Forward indicators suggest this inflation cycle downturn is getting worse, both globally and domestically, and will soon be a consensus story.
Gold continues to chug higher as real interest rates decline. We actually saw 10-year real rates move into negative territory for the first time since 2016. Remember, it is not the level of the real-rate that is important but rather the direction of the move.
For gold to have another leg higher and re-test the 2011 level, a case needs to be made for an additional move lower in real interest rates. This means nominal US Treasury rates need to decline faster than inflation expectations decline.
Generally, I remain bullish of precious metals but am cognizant of the ongoing inflation cycle downturn which could make the path for gold a bumpy one. Precious metals are also at great risk of a sharp decline if inflation expectations have a sudden and sharp decline.
Oil prices continue to trend lower as the ongoing growth and inflation cycle downturn outweighs the geopolitical bid embedded in the exchange-traded price of oil.
The industrial metals equity index has made a new low, below that of the December 2018 "crash", suggesting downward pressure on metals producers remains strong.
The industrial materials spot index, which contains components that are harder to speculate on as compared to highly liquid futures contracts such as oil and copper, seemingly makes new lows each week.
The decline in commodity prices (those off the main exchanges), is severe. The decline in inflation expectations is here to stay and is likely to get worse.
While the consensus narrative has finally caught up to the growth rate cycle slowdown that we saw back in early 2018, the mainstream narrative woefully underappreciates the massive decline in inflation expectations that is having an equal if not more significant contribution to the decline in global bond yields relative to expected monetary easing.
Both European and US inflation expectations are trending below 1.50%. This is without a recession. Should a recession occur, with risks of one rising rapidly, both Europe and the US could be pushed into outright deflationary expectations as a typical recession can easily knock 150bps off of current expectations.
The US Dollar remains in a bullish trend against major currencies and emerging market currencies, as we should expect during global growth slowdowns.
Until there is a cyclical upturn in global growth and inflation, the bias for the dollar remains higher, despite dovish policy from the Federal Reserve.
Money supply growth continues to rise which is a positive sign as a long-leading economic indicator. M2 growth, while considerably off the 2016 high in terms of the growth rate, has rebounded significantly.
M1 growth is also starting to accelerate. This rebound in money supply growth will not have an immediate impact on growth or short-leading economic data.
For cyclical upturns, a sustained rise in money growth typically flows through to shorter leading data with a 6-8 month lead time.
The growth rate in total loans has started to soften. Within total loan growth, we have real estate loan growth which is more leading and commercial and industrial loan growth (C&I) which is more lagging.
Real estate loan growth remains very depressed relative to the prior five years and the growth rate in C&I loans has decelerated notably in recent months (although lagging).
Commercial real estate loan growth has decelerated sharply which is surprising and telling in the face of rapidly declining interest rates. This is an area to focus attention.
While lower interest rates should be beneficial to loan growth, a flatter yield curve, weaker economic growth and decelerating rates of inflation are negative forces that seem to be outweighing cheaper financing costs at the moment.
While real M1 growth held flat month over month, real M2 growth ticked higher again. The acceleration in real money growth is important to note.
While accelerations in growth (rate of change) is the most important, it is also noteworthy that the growth rate in real M1, 2.90%, is far lower than the peak of the economic cycle which saw a rate of growth closer to 10% year over year.
Growth & Inflation Outlook
Nominal GDP growth, as reported by the most recent GDP data, showed a sharp deceleration in growth, falling from a rate of 6% to 4%.
The decline in domestic bond yields is nearly entirely correlated to this deceleration in the rate of growth and inflation. Just as bond yields rose sharply from 2016-2018, when nominal growth accelerated from 2.3% to 6.0%, when growth is in a trend of deceleration, bond yields follow.
Real GDP growth, after several revisions, peaked in mid-2018 and has decelerated 90bps to a rate of 2.30% in year over year terms.
Many characterize this move as a benign reversion to trend without considering the implications a rate of change slowdown in growth has across asset prices including cyclical equity sectors vs. defensive sectors and Treasury rates
more specifically.
Suggesting US growth is "good" or "solid" is a matter of opinion. A factual characterization of US nominal GDP growth is decelerating.
Nominal Final Sales of GDP, or Core GDP, which strips out inventory and net exports, has decelerated much more sharply than consensus is seemingly willing to admit, falling from 6.1% in Q2 2018 to 3.6% in Q2 2019.
A sharp decline in bond yields should not be a surprise in the context of a 40% reduction in core nominal growth.
Forward-looking indicators of both growth and inflation continue to suggest further decelerations in nominal GDP growth which will more than likely be accompanied by lower bond yields.
Not only will consumer prices face a more difficult comparison in Q3 relative to Q2, but commodity prices are also likely to put more downward pressure on inflation.
The current trend of lower rates of economic growth and lower rates of inflation, a regime that began in mid-2018, is set to continue through the end of this year although market participants remain optimistic about a potential rebound.
The risk of the US economy entering the vulnerable economic window has increased significantly. The expected revisions to the nonfarm payrolls numbers, which will not be publicized until February 2020, are likely to shift the growth rate in NFP closer to 1.3% from 1.5%.
Given that employment is one main factor to the coincident index, the economy, from the employment sector, is weaker than the data previously estimated.
If we look at the coincident measure of employment, which is not adjusted for the new revisions, we can see employment growth at one of the lowest levels of this economic cycle.
This index contains nonfarm payrolls growth, the unemployment rate, and measures from the household survey of employment and seeks to track the growth rate of the employment sector on a coincident basis.
Furthermore, the monthly proxy index on real final sales, which includes real retail sales, real final sales, capital goods orders and more, has also weakened to one of the lowest levels of this economic cycle.
The recession risk for the US economy has increased. Employment growth is not as strong as previously estimated in the data.
As such, the growth rate of the entire index will be shifted lower upon the February 2020 revisions.
While this is just an approximate assumption, without the full data in hand, it is highly possible that these revisions, coupled with a significant lag in monetary policy response, puts the US economy on the cusp of the vulnerable window.

") trovato LU1324510525 hedged ter 0,17%
trovato LU1324510525 hedged ter 0,17%