xavier sardá
Nuovo Utente
- Registrato
- 2/6/08
- Messaggi
- 13.377
- Punti reazioni
- 895
metto qui una serie di trading system da applicare con Visual Trader che possono tornare utili
sono un programmatore scarso perciò correggetemi tranquillamente senza problemi in caso di errore o di percorso troppo macchinoso")
un mio professore diceva " chi non ha testa ha gambe "...santa verita
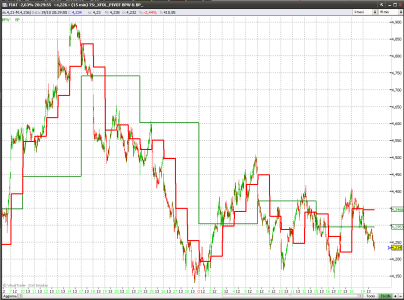
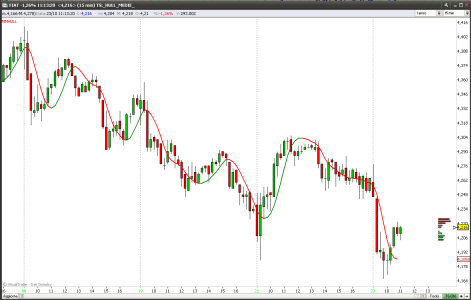
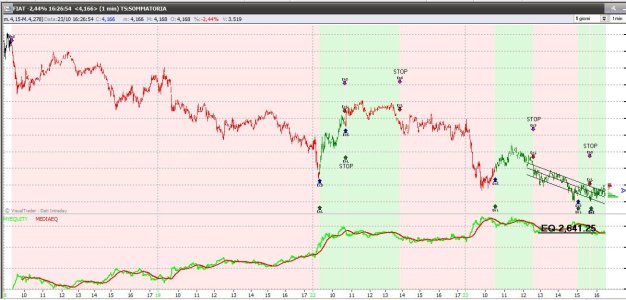
ts BPW e BP
estrae il pivot settimanale e giornaliero
//______________Pivot BPW-BP______________//
Var: newday1(false), mioopen(0), miomin(0), miomax(0), mioclose(0),BP(0);
Var: newday(false),giorno,azzera(0),sOpen ,sLow,sHigh,sClose,BPW(0);
newday1=GetValues(days,1,mioopen,miomin,miomax,mioclose);
if newday=true then
BP=(miomax+miomin+mioclose)/3;endif;
newday=GetValues(weeks,1,sOpen,sLow,sHigh,sClose);
giorno=dayofweek;
azzera=iif(giorno<giorno[1],1,0);
if azzera=1 then BPW=(SHigh+SLow+SClose)/3;endif;
plotchart(BPW,0,green,solid,2);
PlotChart(BP, 0,red, solid, 3);
sono un programmatore scarso perciò correggetemi tranquillamente senza problemi in caso di errore o di percorso troppo macchinoso
un mio professore diceva " chi non ha testa ha gambe "...santa verita
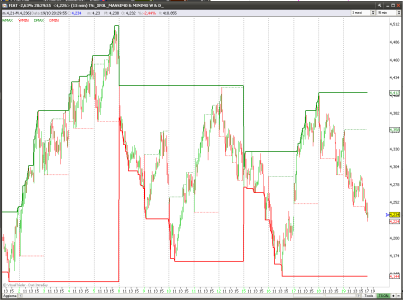
ts BPW e BP
estrae il pivot settimanale e giornaliero
//______________Pivot BPW-BP______________//
Var: newday1(false), mioopen(0), miomin(0), miomax(0), mioclose(0),BP(0);
Var: newday(false),giorno,azzera(0),sOpen ,sLow,sHigh,sClose,BPW(0);
newday1=GetValues(days,1,mioopen,miomin,miomax,mioclose);
if newday=true then
BP=(miomax+miomin+mioclose)/3;endif;
newday=GetValues(weeks,1,sOpen,sLow,sHigh,sClose);
giorno=dayofweek;
azzera=iif(giorno<giorno[1],1,0);
if azzera=1 then BPW=(SHigh+SLow+SClose)/3;endif;
plotchart(BPW,0,green,solid,2);
PlotChart(BP, 0,red, solid, 3);