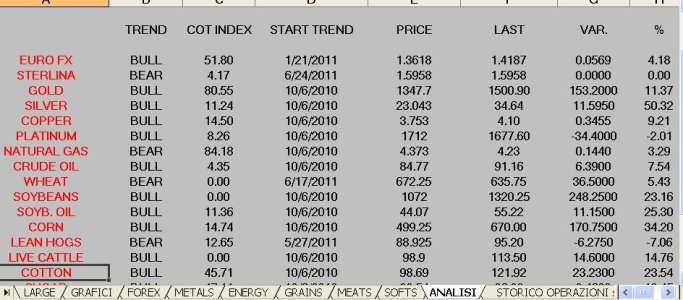
The COT index uses the Net Position values to calculate where the current Net Position reading is when compared to the last x number of readings. For example, if the COT index input box is set to 26 weeks, the result will show where the current reading is as a percentage of the highest and lowest readings of the last 26 weeks. So looking back over the last 26 weeks, if the highest Net position was 10,000 and the lowest Net position was -10,000 and the current net position is zero, the COT index would look like this:
Highest Net position of 10,000 would read 100%
Lowest Net position of -10,000 would read 0%
Current Net position of zero would read 50%
This calculation is a rolling calculation that drops the last number as each week brings a new value. If the current reading is higher than the highest x number of readings then the current reading would be plotted as 100%. If the current reading is less than the lowest x number of readings than the current Net position will be plotted as 0%.
The COT Index is a quick way to see how long, or short, each of the 3 groups is at a glance. By adjusting the number of weeks used in the COT index, major turning points in each market can be aligned with extreme historical COT index readings. Once a good fit is found for a specific commodity, the COT index can be used to look for turning points as they happen.
")